StatSharp Introduces NHL Player Stats Coverage: Revolutionizing the Way You Analyze Hockey
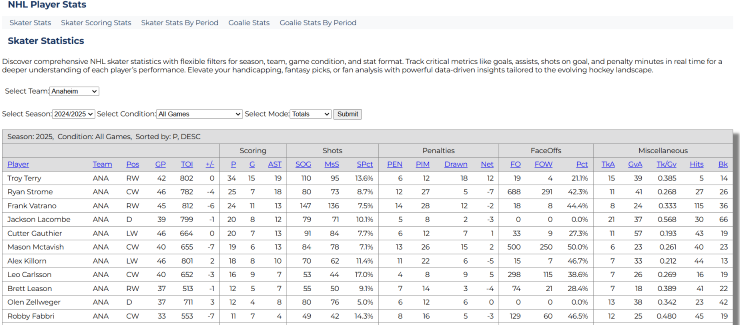
At StatSharp, we’ve always believed in the power of data to enhance the sports experience. That’s why we’re thrilled to announce our brand-new NHL Player Stats Coverage, bringing you comprehensive insight into every facet of hockey performance. Whether you’re a coach looking for the competitive edge, a journalist seeking deeper reporting angles, or a devoted fan wanting to understand the game like never before, this feature was designed with you in mind.
To make sure you get the most out of our new release, we’ve built an intuitive interface that puts the right information at your fingertips. From customizable searches to in-depth matchup views, StatSharp’s NHL Player Stats Coverage delivers data in ways that are easy to digest and even easier to act upon. Here’s an inside look at what you can expect.
Customizable Player Stats Search
1) Choose among numerous game conditions
The first step to meaningful analysis is filtering out irrelevant data. Our new NHL stats search includes game conditions like Home Games, Division Games, and even Playoff Games. This level of customization makes it simple to see how a player performs under the exact conditions that matter to you. Does a certain forward thrive on the road? Do goalies perform differently in key division matchups? Now, you can find out with just a few clicks.
2) Switch between full league and individual teams
There’s no longer a need to navigate multiple pages to see league-wide performance versus specific team-based data. With StatSharp’s simple toggles, you can shift seamlessly between a full-league overview and a team-specific view. Whether you’re scouting an upcoming opponent or just tracking your favorite players, this flexibility lets you explore performance metrics on your own terms.
3) Sort the stats your way
From classic categories like Goal Scoring and Assists to deeper analytics such as Shots on Goal, Penalties, Face Offs, and Hits, you choose how to organize the data. Want to see who’s leading the league in blocked shots or giveaways? It’s all accessible at the click of a button. For goalies, we’ve included metrics like Save Percentage, giving you a complete view of a netminder’s performance. By personalizing your sort criteria, you’ll quickly identify potential breakout players, track trends, and isolate game-changers in specific areas of play.
4) Explore 20+ years of past seasons
Historical context can provide valuable insights, whether you’re comparing a current superstar to legends of the past or looking for patterns in a team’s playoff runs. Our database stretches back over two decades, delivering a robust archive that’s perfect for trend analysis, storytelling, or just satisfying your curiosity about how the game has evolved over time.
5) Toggle between multiple stat categories
Not every situation calls for the same kind of data. That’s why we’ve introduced an easy toggle system that includes Skater Stats, Skater Scoring Stats, Skater Stats By Period, Goalie Stats, and Goalie Stats By Period. This versatility means you can switch perspective depending on whether you’re focusing on all-around play, scoring, goaltending, or even period-specific performance. By diving deeper into these various lenses, you can uncover hidden patterns and make more informed decisions—whether it’s for coaching, commentary, or fandom.
Player Stats on Matchups
1) Display each opponent’s player stats
Analyzing strengths and weaknesses is essential before any big game. Our matchup feature consolidates the opposing team’s player data into a single, easy-to-view format. Quickly see how each line contributes in terms of offense, defense, and special teams, and identify any glaring mismatches or weak spots before the puck drops.
2) Stat highlighting for top performers
Rows of numbers can sometimes be overwhelming. To combat data fatigue, StatSharp incorporates stat highlighting, drawing your attention to notable areas: players on a hot streak, those who have been underperforming, and individuals who rack up frequent scoring chances. This makes it easier than ever to spot trends and prioritize your scouting efforts.
3) Show stats only for relevant conditions
Why wade through unnecessary data when you can focus on exactly what matters for the upcoming matchup? Our platform automatically filters and displays the conditions relevant to each game. This helps you concentrate on the stats that have the most impact in the specific context of your next face-off—like how a team’s penalty kill stacks up on the road or how a goalie performs in back-to-back games.
Elevate Your Hockey Insight with StatSharp
StatSharp’s newly launched NHL Player Stats Coverage sets a new standard for usability and depth in hockey analytics. By offering customizable searches, robust statistical views, and streamlined matchup data, we empower everyone involved in the sport to make better decisions faster. Experience the difference for yourself and discover what comprehensive, context-rich data can do for your understanding of hockey.
Ready to dive in? Head over to: https://www.statsharp.com/nhl/nhl-hockey-player-stats/ today to explore our NHL Player Stats Coverage and unlock the full picture of the game you love. Whether you’re coaching, betting games, or playing fantasy hockey, StatSharp ensures you never miss a detail.

